
 Have you ever wondered how your spending habits compare to that of your friends and neighbours?
Not compared to the spendthrifts (where you may come out better) or the frugals (you spend much more), but compared to average Australians?
Now you can find out. The Australian Securities & Investment Commission’s Moneysmart website provides a snapshot of what Australians really spend their money on. The information is further broken down by state and life stage.
Understanding where your money is going is the first step to helping you manage your budget. Seeing how you compare to other average Australians can help you work out where you can make changes to your spending habits.
The average household is estimated to spend $69,166 each year on general household living costs. Living costs include housing costs, utilities, food, clothing, transport, recreation and even your pets. It’s how much you spend to live the way you do.
This translates to an average household spend of about $5,800 each and every month, or $1,330 every week. Interestingly, the 2011 census calculates the median weekly household income as $1,234, which leaves the average person accumulating more debt with each passing week and little chance of paying it down.
These average weekly costs can be broken down further as follows:
- Housing $223
- Transport $193
- Recreation $161
- Household furnishing and equipment $59
- Clothing and footwear $44
These costs total only $680, which leaves on average another $650 spent every week on food and other necessities – as well as life’s little luxuries.
In comparison, housing costs in the 2011 census show that the median monthly mortgage repayments were $1,800 and the median household weekly rent was $285. This means the housing cost on the Moneysmart website must take into account people who have paid off their mortgages, and pushing down the housing costs for an average household.
There are also differences in each state that need to be taken into account, with the highest living costs being in the ACT at $1,536 per week, followed by the Northern Territory at $1,500 per week. South Australia was the least expensive at $1,044 per week.
Weekly spend by life stage
These figures become even more helpful when we are able to compare like for like, depending on how your household is made up.
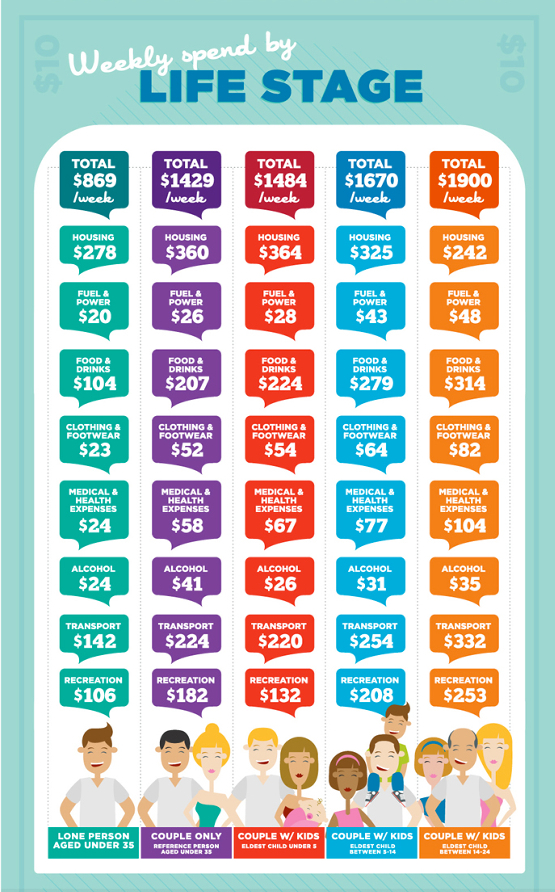
Source: www.moneysmart.gov.au. Data from www.ibisworld.com.au, Australian Bureau of Statistics Household Expenditure Survey 2009-10
See where you fit and how you stack up against the average household based on your situation. This provides a useful starting point to see where you can start to make some real savings.
